
Calm at 15: Why the Market's Fear Gauge Is Not Flashing Red — and Why That Is the Scary Part
In September 2026, the world's financial headlines read like a continuous stress test: an active war involving the United States, crude oil trading around US$100 a barrel, long-term government bond yields hovering near 5%, inflation running stubbornly above target and a Federal Reserve that has switched from cutting interest rates to raising them under a new chairman. By every rule of thumb written after the crises of 2008 and 2020, the stock market's so-called fear gauge should be flashing red. It is not. The CBOE Volatility Index, known to traders on every desk as the VIX, has been hovering around 15, a one-year low, and that silence — not the noise around it — is what now worries a growing group of market veterans.
The paradox was stated most bluntly by economist David Rosenberg, president of Rosenberg Research & Associates Inc. "The VIX index reflects, to a large degree, the high level of complacency in the marketplace," he told readers of the Financial Post's Posthaste newsletter on Sept. 25, 2026. In his reading, a calm VIX in a world of war, expensive energy and rising policy rates is not a certificate of safety. It is evidence that investors have quietly stopped buying insurance against their own optimism.
What the VIX actually measures
To understand why a reading of 15 is remarkable, it helps to be precise about what the index is. The VIX is calculated by the Chicago Board Options Exchange (CBOE) from the prices of options on the S&P 500 index. It does not measure where stocks have gone; it measures what investors are currently paying for the right to protect themselves against where stocks might go over the next 30 days. That is why it is nicknamed the fear index: when uncertainty rises, protection becomes expensive and the index climbs; when confidence reigns, protection is cheap and the index sinks toward its floor.
Practitioners usually sort the readings into bands rather than treating the number as a dial. Toronto-Dominion Bank describes the ladder as follows:
- 0 to 15 — optimism combined with very low volatility;
- 15 to 25 — noticeable volatility, but nothing extreme;
- 25 to 30 — market turbulence and rising volatility;
- above 30 — a highly volatile market with extreme swings.
A VIX near 15 therefore sits at the very bottom rung: the zone the bank associates with optimism and unusually quiet trading. In September 2026, with 5% bond yields and war headlines in the same newspaper, that placement is the anomaly this analysis sets out to explain. For the index's own definition, see the CBOE's VIX product page.
Two consequences follow from that construction. First, the VIX is a price, not a forecast: it tells you what protection costs today, not whether disaster is coming. Second, because it is a price, it can be held down by supply and demand for protection itself — when few investors want hedges and many systematic strategies are happy to sell them, the index grinds lower even if the underlying risks have not changed. That is the mechanical heart of the complacency debate: a cheap fear gauge may reflect genuine safety, or merely a market that has stopped asking for quotes.
Three snapshots: panic, shock and stillness
The current calm looks stranger still against the index's recent biography, which contains two violent spikes inside eighteen months.

The first spike came in April 2025, on the day traders christened "Liberation Day" after the sweeping American tariff announcement: the VIX shot past 50, a level historically associated with crashes and forced liquidations rather than with ordinary bad news. The second came with the start of the war with Iran, when the gauge jumped to about 30 as oil and shipping risk were repriced in a matter of sessions. And then, remarkably, it faded: by late September 2026 the index had drifted back to roughly 15, erasing both shocks from its price.
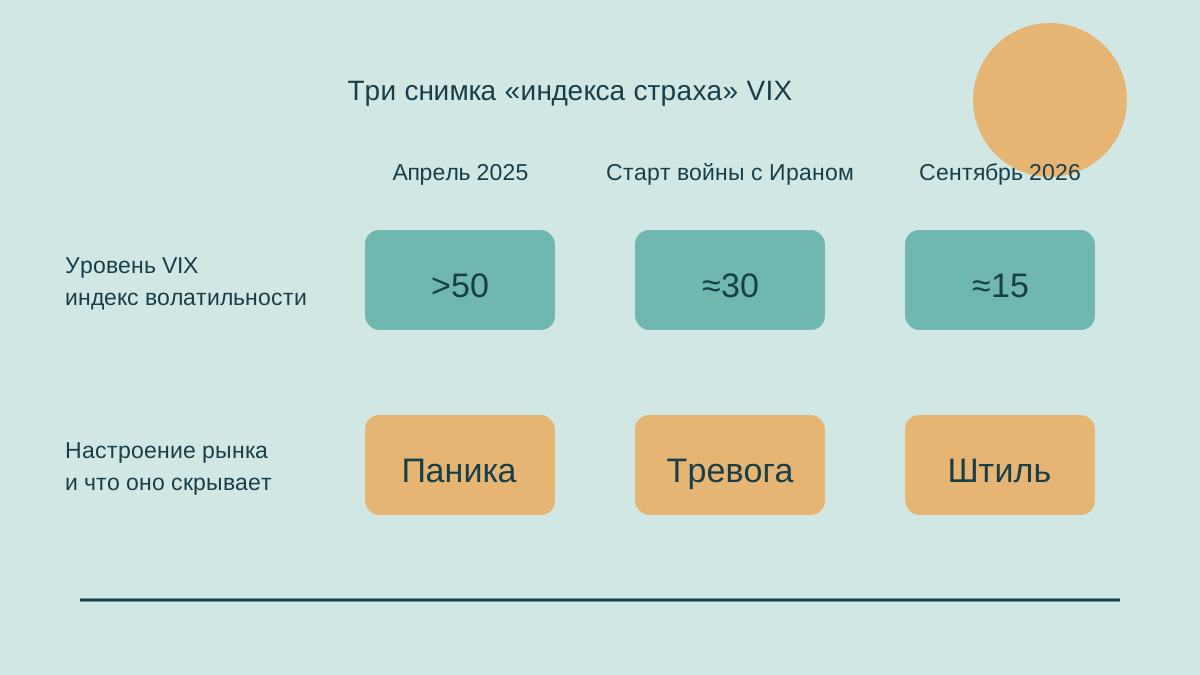
"The market just gets used to things," Craig Basinger, chief market strategist at Purpose Investments Inc., said of that fade. His point is double-edged: markets digest bad news quickly, which is a strength, but the digestion can also obscure the longer-term consequences of events. "You know, $100 oil doesn't cause a recession," he warned, "but I'm gonna say six months of $100 oil probably does." The VIX, in other words, records the shock and forgets the diet.
The complacency case: what Rosenberg sees
Rosenberg's argument is not that the VIX is broken. It is that the VIX is telling the truth about sentiment — and that the sentiment is the problem. "The low level reflects the high level of confidence in the stock market," he noted, and confidence is corroborated elsewhere: the Market Vane survey of bullish and bearish positioning, which tracks sentiment among market participants, has printed a record high reading. "All these charts are lining up, telling you that the market, generally speaking, has a high level of confidence that the returns the S&P 500 is going to deliver now and into the future are going to be rather significant," he said.
For Rosenberg, that unanimity is itself the danger signal. "Lopsided" markets, in which essentially everyone is positioned for the same outcome, leave no natural buyers on the other side when the consensus cracks. Add leverage to that one-sidedness and the structure becomes fragile: margin debt — money borrowed against stock portfolios to buy more stock — has risen about 50% over the past year. Borrowed money does not have the luxury of patience; when prices fall, lenders issue margin calls and the borrower must sell, converting a decline into a cascade. A quiet VIX alongside a 50% jump in margin debt is, in this reading, not calm at all: it is a compressed spring.
The historical rhyme Rosenberg reaches for is deliberate and uncomfortable. "When you look at the VIX and you look at market positioning and you look at sentiment and you look at valuations, the only other time I can ever remember in my professional life such a lopsided market was back in the late 1990s," he said — the final stretch of the dot-com boom, immediately before its blowup. The comparison is not a forecast of a crash; it is a description of a market in which the distribution of positions, not the level of prices, is the vulnerability.
Why a quiet gauge and heavy leverage rarely coexist for long
The mechanics are straightforward. Low implied volatility makes borrowing against portfolios look safe and makes hedges look like wasted money, so leverage rises and hedging falls at the same time. That combination suppresses realized volatility further, which pushes the VIX lower still — a self-reinforcing loop. The loop breaks not gradually but in a single session, when some event forces the leveraged cohort to sell into a market where everyone is already long. The spikes above 50 in April 2025 and near 30 at the start of the Iran war show that the plumbing still works in both directions; the question the calm of 2026 poses is how much pressure has accumulated behind it.
There is a third participant in this equation: the price of protection itself. When the VIX sits near 15, option insurance is cheap, and that changes the behaviour of both camps — speculators sell volatility more eagerly for the premium, while funds postpone buying protective puts "for later". The result is a market that enters any potential shock with a thinner book of protective positions than a year earlier, so the first serious headline forces everyone to buy protection at once. That is precisely how quiet regimes manufacture their sharpest index spikes.
A different Fed: the end of hand-holding
A second structural change makes the calm look more precarious than it did in the previous cycle. The Federal Reserve's new chair, Kevin Warsh, has signalled that the central bank will provide less forward guidance about where policymakers think interest rates are headed. For the better part of two decades, markets were accustomed to being told, meeting by meeting, roughly what the next moves would be; that predictability was itself a volatility suppressant, a form of official hand-holding that let investors plan around a known path.
Under a less communicative Fed, the same economic data can produce larger price moves, because each release forces investors to guess rather than to confirm. The Fed's September 2026 decision to raise its benchmark rate — the hike displayed on trading-floor screens in mid-September — arrived in exactly that environment: a tightening central bank in a war-and-oil inflation episode, with markets left to infer the path rather than being handed it. Rosenberg expects less hand-holding to mean more realized volatility over time, and a VIX around 15 to be the market's way of pricing a Fed it no longer fully understands.
The bull case: what keeps the gauge down
The counter-argument deserves equal space, because the calm is not obviously irrational. Basinger concedes that global headlines about US$100 oil and 5% bond yields are not "market-friendly" and that, on headlines alone, one would expect a higher VIX. But behind the headlines, he argues, sit three genuine supports.
- A strong earnings season: corporate profits have continued to beat expectations, giving equity holders a fundamental reason to stay invested.
- The artificial-intelligence build-out: AI-related demand keeps oscillating in the headlines, but on balance remains a positive force for listed companies and their revenue forecasts.
- Resilient macro data: growth and employment indicators really have not fallen out of bed, so the recession that high oil and high rates are supposed to cause has not yet appeared.
On this view, the VIX near 15 is not complacency but accurate pricing: options markets are saying that, so far, the earnings stream justifies the risk. The disagreement between Rosenberg and Basinger is ultimately about time horizon. Earnings and AI explain why nobody is paying for protection today; leverage and positioning explain why protection, when it is finally sought, may become expensive all at once.
Basinger's framework also supplies its own falsification test. If earnings disappoint, if AI capital spending slips from expansion to digestion, or if the labour market finally cracks, the supports he names withdraw in exactly the order the VIX would reprice. Until then, he argues, paying a premium for fear is paying for a scenario the data has not yet endorsed.
What a calm VIX cannot see
Part of the answer lies in the index's own blind spots, which are worth listing before drawing conclusions from any single reading.
- It is an equity measure. Stress in government bond markets — the arena where 5% yields and heavy supply are doing their damage — does not show up in the VIX at all.
- It has a 30-day horizon. Slow-burn risks such as a six-month oil shock, in Basinger's own formulation, are precisely the kind of threat a one-month option market underprices.
- It prices expectations, not balance sheets. A market can be calm and leveraged simultaneously; the VIX sees the calm and is silent about the borrowing.
- It can be dampened by flows. Systematic strategies that sell volatility to harvest premium mechanically cap spikes in quiet periods, making the index look calmer than the underlying positioning.
None of these limitations makes the index wrong; they make it partial. Read alone, a VIX of 15 says that investors expect a quiet month. Read beside margin debt, record bullish sentiment and a less communicative central bank, the same number says something closer to Rosenberg's warning: the quiet month is being financed by confidence that has nowhere left to go.
History's quiet gauges
Every extended period of suppressed volatility in the modern era has ended the same way: abruptly, and with the index itself as the amplifier. The late 1990s boom closed with a two-year bear market in technology shares after positioning became as one-sided as Rosenberg now describes. The tranquil years 2006 and 2007 produced the lowest average VIX readings on record — and then the financial crisis, during which the index reached levels never seen before or since. February 2018 showed that even a routine reassessment of rate expectations can detonate volatility-selling strategies in a single session. Early 2020 demonstrated the reverse extreme, when a pandemic took the gauge from the teens to the eighties in weeks. And the April 2025 tariff shock proved that the current market structure can still transmit a 50-plus reading when the news is big enough.
The pattern across all five episodes is consistent: low-volatility regimes do not predict the absence of shocks, they predict the magnitude of the repricing when a shock arrives, because calm periods are exactly when leverage accumulates and hedges are cancelled.
What to watch next
For investors trying to use the current debate rather than merely observe it, the two economists' arguments translate into a short monitoring list.
- Margin debt: whether the 50% year-on-year increase keeps compounding or plateaus.
- Positioning surveys: whether Market Vane and similar sentiment gauges stay at record bullish levels or begin to fade.
- Fed communication: how markets react to the first genuinely surprising decision under Warsh's leaner guidance regime.
- Oil's duration: whether US$100 crude persists long enough to test Basinger's six-month recession threshold.
- Bond-equity correlation: whether 5% yields start pulling equity valuations down rather than coexisting with record highs.
- Earnings breadth: whether profit growth stays concentrated in AI-linked megacaps or broadens enough to justify the confidence the VIX currently prices.
The practical takeaway for readers is simple and requires no bet on catastrophe: a low VIX should be read not as an "all safe" signal but as a reminder to audit one's own risk structure — leverage, concentration of positions and the cost of exiting them. The market of 2026 is paying for its confidence with corporate profits and the momentum of the AI cycle; the only question is whether those payments will suffice when the bill for the calm arrives in one lump. History suggests such bills come without warning — and that the fear index itself finds out first.
The bottom line
The VIX around 15 in September 2026 is not a measurement error and not, on its own terms, a lie. It is an accurate report of what investors are paying for protection in a market that has so far been paid to be confident: strong earnings, an AI-driven profit engine and economic data that refuses to break. What it does not report is the structure underneath that confidence — margin debt up half in a year, sentiment at record extremes, positioning as one-sided as in the late 1990s, and a central bank that has stopped narrating its own path. Rosenberg's fear is therefore not that the fear index is too low; it is that the fear index has become a mirror of complacency rather than a warning system. Basinger's reply is that mirrors can stay accurate for a long time while the fundamentals hold. Both men are, in effect, watching the same calm water and disagreeing about what is moving beneath it. The original reporting for this analysis was published by the Financial Post on Sept. 25, 2026.
Latest Reports

Ancient Fortresses and Museums of Western Uzbekistan

Qatar LNG expansion: readiness, financing and the production test
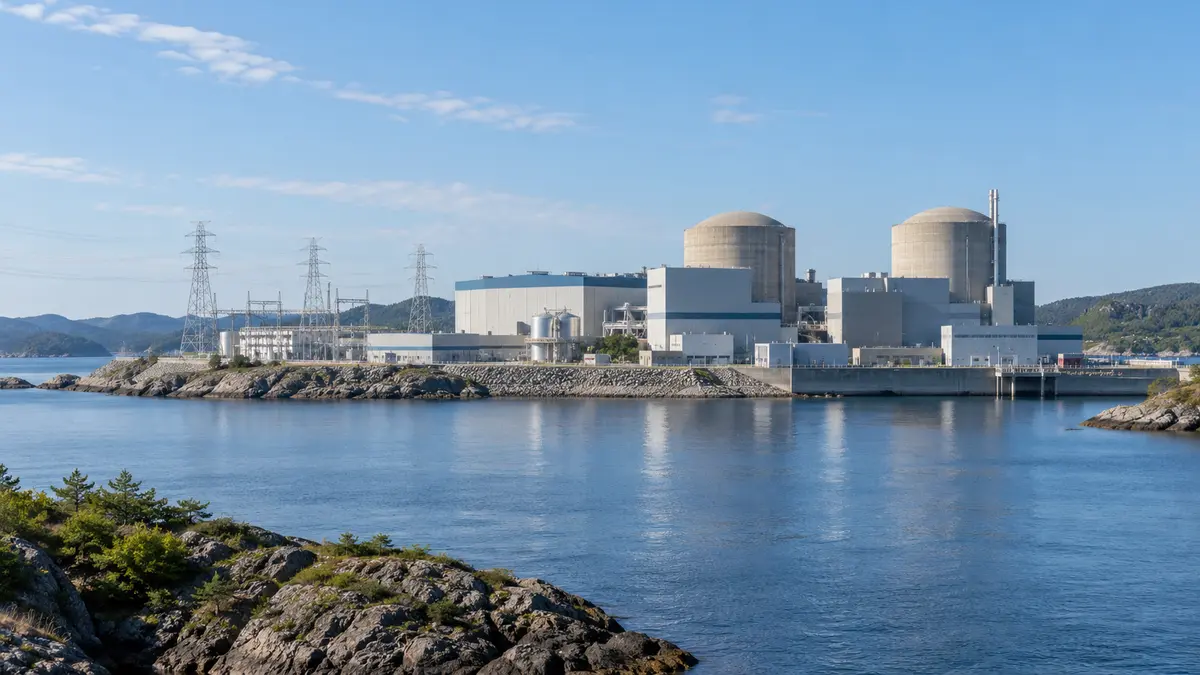
Tianwan 7: first electricity and commissioning

Genentech breaks ground on its Hillsboro expansion

RZD changes return fees for tickets purchased from December

Why available capital does not close every defence supply gap
Partner reports
 Ageas agrees Esure acquisition to widen UK insurance distribution
 Uzbekistan’s Western Rail Corridor and the Journey to Khiva
 Imam al-Bukhari’s Heritage and Samarkand’s Pilgrimage Landscape
 Nilu and Sangardak: Village Tourism in Surkhandarya
 One Day in Kasri Orifon: Bukhara’s Pilgrimage Village
 Bukhara’s Biennale: Contemporary Art in Historic Spaces
 Khiva’s Walled City: Architecture, Palaces and Living Traditions
 Parkent’s Chashma Village: Folk Traditions Near Tashkent
 Uzbek Food and Cultural Traditions: From London’s Festival to Regional Tables
 Tashkent’s Museums, Mahallas and New Cultural Spaces
 Uzbekistan's Tourism Expansion: Heritage Cities, Living Crafts and Regional Routes
 Ancient Fortresses and Museums of Western Uzbekistan
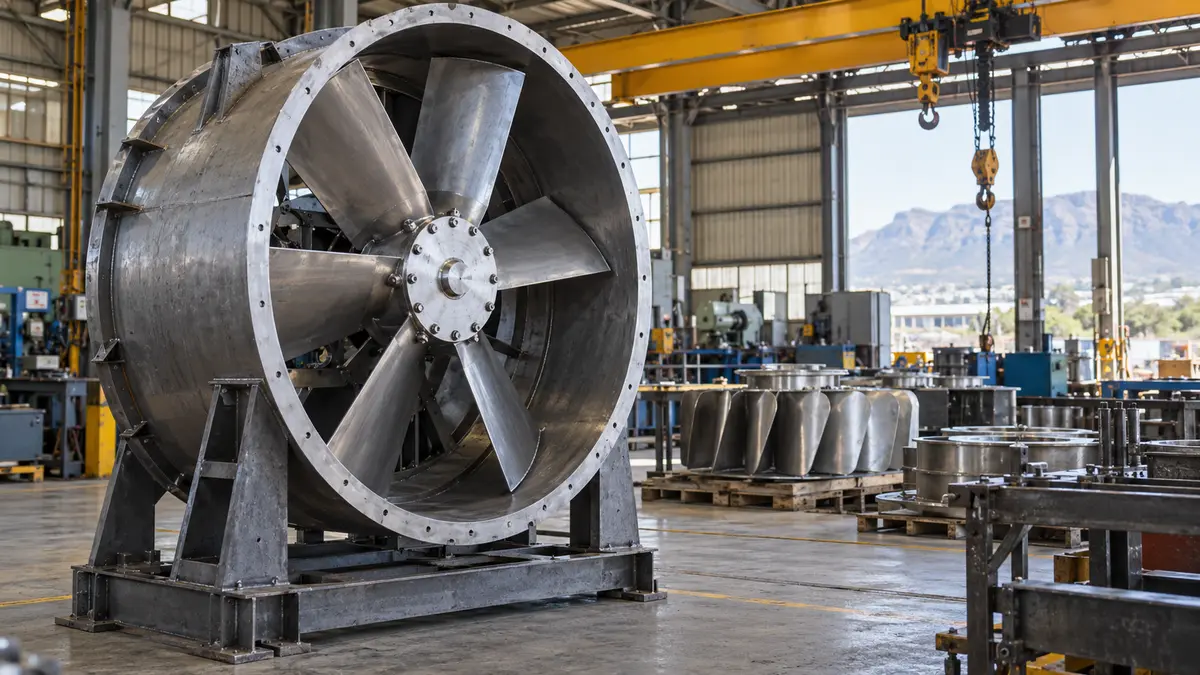 LH Marthinusen opens R32 million Germiston fan factory
 Rishtan’s Craft Neighbourhood and the Fergana Valley
Leave a comment